
Savings Review 16/17
It’s that time of the year again.
Time to review where every single one of the precious dollars we earned last financial year went.
This is usually an eye opener, but we review our spendings monthly so it shouldn’t be too much of a shock.
It will be interesting though because this is the first full year Mrs. Firebug and I have spent together with our finances joined.
I posted my savings rate last FY in this POST. I’m under no illusions that a savings rate of 74% will not be repeated again this year. I have hope that we will be around the 60s though. We did spend a lot of money when we moved with new furniture and what not.
Enough rambling, let’s get into it!
Savings Rate For 16/17 Financial Year

Our savings rate for last financial year was… 63%
We earned $137,419 (after tax)
And spent $50,595
Pretty pleased with 63% tbh.
Anything above 60% was winning for us.
Being in a relationship is all about sacrifices. The last year by my standards was extremely luxurious with a heap of unscary spending. But Mrs. FB felt we were very frugal and tight. At the end of the day, it’s a sensible a sustainable budget that’s going to work and both parties need to be happy with it.
I felt we struck that balance this year gone. And as all the fellas out there know…
“Happy wife, happy life”
Even though I’m not married… These are words to live by ??
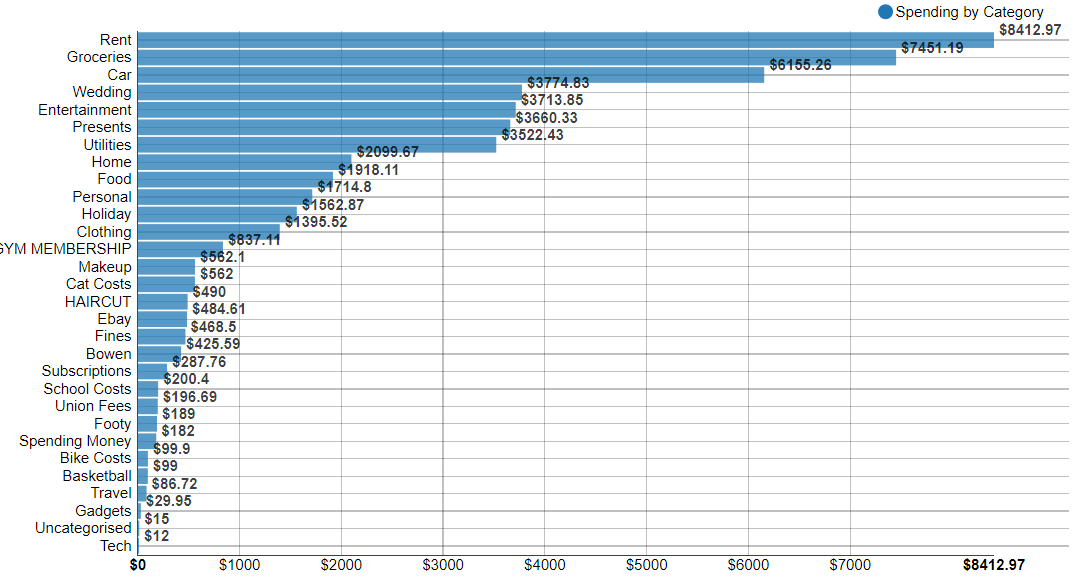
Breakdown Of Spending
Down to the nitty gritty.
How in the hell did we spend over $50K!?
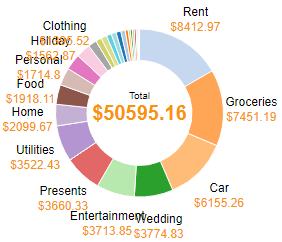
and in pie form
Let’s start with our biggest expense…RENT!
$161 bucks a week is great. But that included 2 months house sitting my parents home before we moved into our new place. So it’s really about $195 bucks a week which sounds about right.
I’m sure some Metropolitan readers out there are shocked at how low that rent is, but that’s just one example of the cost of living differences between the city and the county.
Groceries is next up. Man, we eat a lot! But let’s break it down to how much we spend a day to fuel our bodies.
$7,451 on groceries + $1,918 on food + $2,176 on entertainment>food
Those three different categories account for everything we consume (except booze)
= $11,545 a year on food
=$222 a week
=$31 a day
=$16 a day per person
It’s actually more like $21 per day for me and $10 per day for Mrs.Firebug because I eat so much more than her.
I have to be honest. I’m actually shocked that we only spend $16 a day on food each. Considering that this figure includes every time we go out for dinner for like $70-80 bucks, breakfast Sundays, birthday dinners …everything. I eat 6-7 meals a day too. We could definitely improve this category by not going out so much but we live a great lifestyle and there’s always fat to be trimmed if we need to I guess.
It helps that we both make our lunches every day and hardly ever go out during the week.
The car expense is pretty standard. With the change of job this year, the fuel costs should go down though.
And then comes 3rd place…WEDDINGS!
That’s right, we spent $3,774 attending, participating, flying to and from weddings in 2016/17. CRAZY!
The only other two things that jump out at me are how much we spent on presents and utilities.
I know it’s hard because every household is different but is $150 a month a decent usage amount for gas/electricity? I’d be interested to know how much everyone else spends on utilities.
How Do You Compare?
We managed a 63% savings rate last FY. This included rent, food, car costs, holidays, a bunch of weddings…absolutely everything!
And it didn’t feel like we sacrificed at all! In fact, I still think we could cut out heaps of unnecessary spendings if we really needed to. But as mentioned earlier. Reaching FIRE with a partner is about sacrifice and compromise. And I felt like we struck a nice balance last FY.
But I will use this year’s numbers to set the target for next year.
70% here we come!