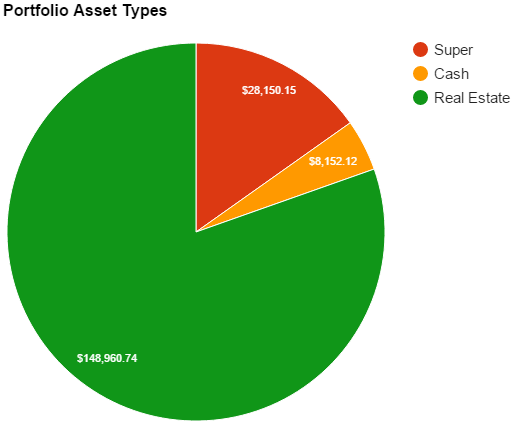
Not a lot to report on this month. I managed to save around $4K but my super went down a little. Christmas is approaching very soon and my worst savings month last financial year was December so I’m looking to take a hit again this time. I’ll try to manage it a little better hopefully.
Networth
[wp_charts title=”linechart” type=”line” align=”alignleft” width = “100%” datasets=”-36000,-36000, -32000,-7000,20000,32000,45000,65000,83254,130000″ labels=”1-Jan-2011,1-Jul-2011,1-Jan-2012,1-Jul-2012,1-Jan-2013,1-Jul-2013,1-Jan-2014,1-Jul-2014,1-Jan-2015,1-Jul-2015″]
| Date | Rolling NetWorth | $ Change | % Change | Notes |
| 1-Jan-2011 | -$36,000.00 | $0 | 0.00% | HECCS debt |
| 1-Jan-2012 | -$32,000.00 | $4,000 | 0.00% | Started Full-time work late Nov |
| 1-Jan-2013 | $20,000.00 | $52,000 | 0.00% | Built property and recieved FHOG ($21,000) |
| 1-Jan-2014 | $45,000.00 | $25,000 | 125.00% | |
| 1-Jan-2015 | $83,254.21 | $38,254 | 85.01% | Bought second IP |
| 17-Feb-2015 | $110,215.44 | $26,961 | 32.38% | |
| 18-Feb-2015 | $121,541.41 | $11,326 | 10.28% | IP’s re-valued |
| 4-Mar-2015 | $123,715.44 | $2,174 | 1.79% | |
| 18-Mar-2015 | $122,128.44 | -$1,587 | -1.28% | Paid for holiday |
| 15-Apr-2015 | $125,906.00 | $3,778 | 3.09% | Withdrew equity from property |
| 14-May-2015 | $127,906.96 | $2,001 | 1.59% | |
| 18-Jun-2015 | $131,904.96 | $3,998 | 3.13% | |
| 21-Jun-2015 | $152,904.96 | $21,000 | 15.92% | IP’s re-valued |
| 12-Jul-2015 | $159,904.96 | $7,000 | 4.58% | Paid 4K off HECS Debt |
| 23-Jul-2015 | $161,904.96 | $2,000 | 1.25% | |
| 31-Aug-2015 | $167,904.96 | $6,000 | 3.71% | |
| 31-Sep-2015 | $170,110.89 | $2,205 | 1.31% | Car went out of Portfolio, Bought IP 3, Super went up and one IP went up |
| 31-Oct-2015 | $171,376.01 | $1,265 | 0.74% | Big bills. Not much saved. |
| 30-Nov-2015 | $173,263.01 | $1,887 | 1.10% | Super went down slightly |


When showing net worth, you need to break it down into –
Networth = Assets – Liabilities
I sort of have done that already with the above. Do you mean showing the whole amount of the assets worth (in which case it’s around $900K) and the whole amount of all liabilities?
I figured it would be easier just to display the difference between the two
Just showing equity masks the debt burden, a 83% LVR is too high and will give you little room to move when house prices start to stagnate/fall.
Well firstly my LVR is not 83%, not sure how you calculated that.
Secondly, LVR and house prices mean nothing. It’s all about the rental yield and interest rate.
If one of my houses went up tomorrow by $100K, sure it would be nice but I’d much rather the rent go up by $20 bucks or interests rates to drop because it’s those components that really matter it terms of serviceability.
The same goes if my properties dropped in value. Not really fussed, I would be more concerned if the rent fell substantially or interest rates went up.
I account for a two percent rise in interest rates when I crunched the numbers before I buy anyway.
You only make a loss if you sell during a downtime, it the cash flow is there you can ride it out forever until the market bounces back.
Debt = Assets – Equity
= 900 – 148
= 752k
LVR = Debt / Assets
= 752 / 900
= 83%
Your equations are almost correct but there is a major flaw in them.
You’re assuming that all assets are leveraged. The $900K in your figures includes non leveraged assets which you have not accounted for.
I’ll save you the trouble and just tell you that around the time of this article my LVR was sitting on 79%, this has since gone done even further because one of my IP’s have increased in value.
79% LVR may be too high for some but I’m comfortable with that level of risk. Again I don’t really look at LVR it’s more about cash flow for me.
Cheers
The calculations are fine.
It is the information that you have provided which is inaccurate.
That is why you need to show debt and assets separately.