
by Aussie Firebug | Aug 30, 2020 | Investing, Mindset, Saving
This years review is a bit tricky once again because we (Mrs. FB and I) earnt money in two different countries so some of the tax stuff has not been accounted for (yet).
You can check out last years review here where we achieved a savings rate of 56%.
So how did we do this year?
Let’s get into the numbers.
Savings Rate For 19/20 Financial Year
Our savings rate for last financial year was… 61% (▲+5% from last year)
We earned $200,919 (▲+$15,478…mostly after-tax*)
And spent $79,182 (▼+$1,635)
I’m honestly shocked that we ended up with 61% as our savings rate. I think a lot of that had to do with COVID hitting which essentially stopped us (and most of the world) from spending money on anything other than the essentials. The only way I can explain how we managed to spend less than the previous FY (other than COVID) is that we pre-paid for a shit load of travelling in May 2019 that obviously is not included in this year’s report. That travelling lasted all the way up until the end up September so even though we have been technically paying for London’s notoriously high living costs, 3 months of this years review was pre-paid for from the previous year which makes it appear that the last 12 months were cheaper than they really were.
*This year’s update does account for AFB tax obligations since I was required to pay them during the year but the dividend components are not finished yet. I’ll update this article once it’s done
Breakdown Of Spending
Because we use two different pieces of software (pocketbook for Oz and money dashboard for UK) to track expenses, they are broken down into two categories.
Australian expenses = AUD $8,328
UK expenses = AUD $70,854
Below is our Australian expenses for the last FY.
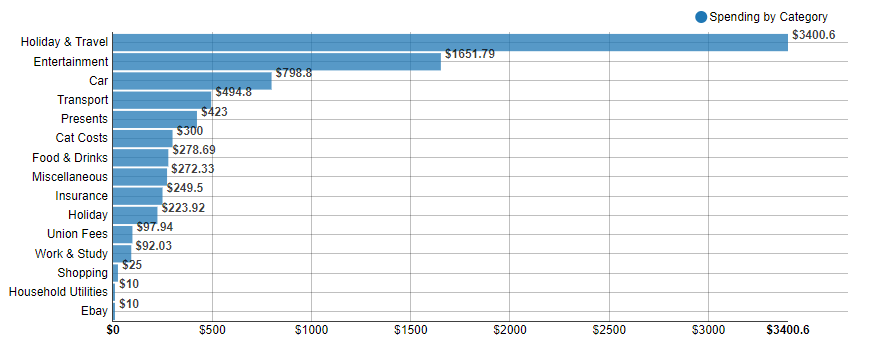
There were a few expenses we still needed to take care of back home like car rego (Mrs. FB’s mum is currently driving her car), insurances and some odd bits and bobs. The biggest expense above is Holiday & Travel because there were occasions where we used our Australian Citibank card instead of our UK card and hence those expenses showed up in our Aussie accounts.
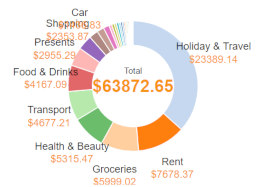
And here is a high-level breakdown of our UK expenses
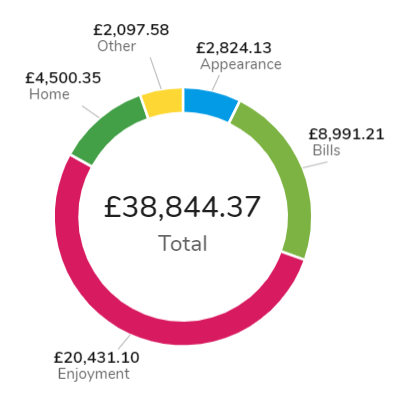
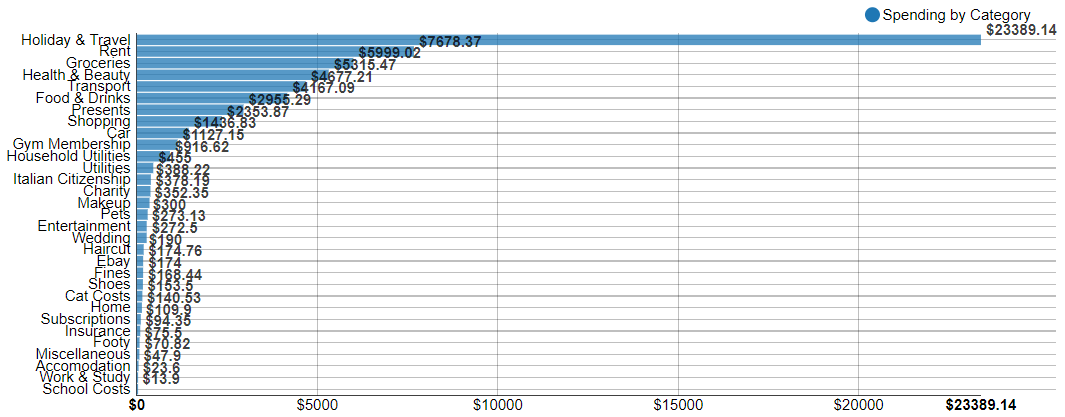
And here are all of those categories broken down again so you can get a better idea of where we spend our money.
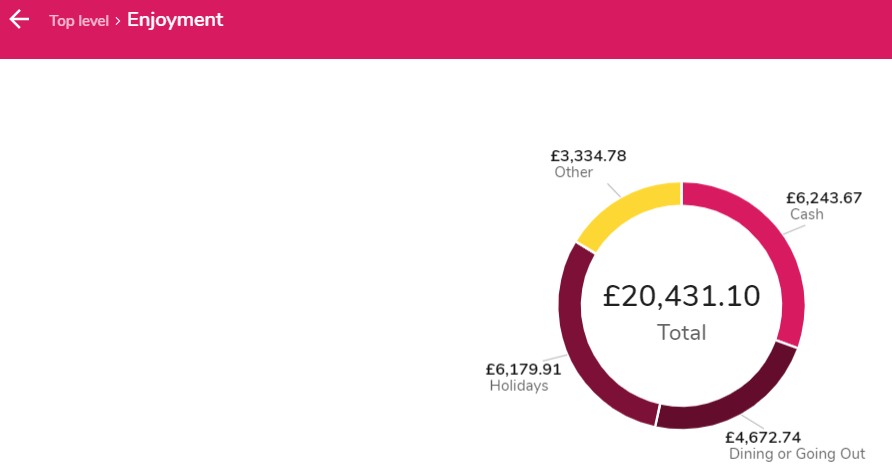
It’s no surprise that for the second year running our Holidays category is right at the top. The Cash category is hard to group because we went to a lot of countries where we would have to withdraw a heap of cash to spend whilst we were there. Egypt was a good example of a country that still predominately uses cash as opposed to EFTPOS. So you could almost certainly group up to 90% of the Cash category into the Holidays too which would make it number one. We try a new restaurant in London every single week and dined out a hell of a lot during our travels so I’m not surprised to see Dining and Going Out up so high. It’s one category that will plummet once we get home back to our country town purely because there are not that many options where we’re from 😅.
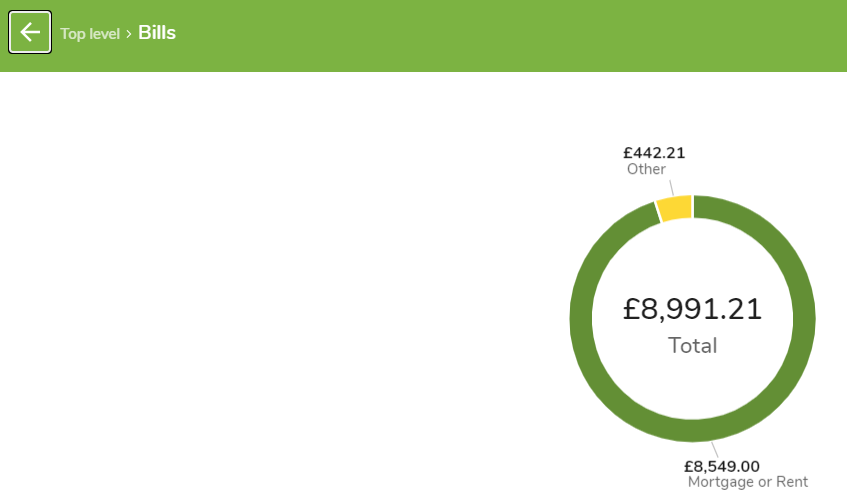
Anyone who has lived in London can back me up when I say that the cost of living here is insanity! I mean honestly, unless you have a decent-paying job (>£50K) you’re much better off moving to Liverpool or Manchester. Rent will be halved and the general cost of most things will be down too but you’ll still get the benefit of being on Europe’s doorstep for travelling. One thing to take into consideration with the above number is that we only paid 8 months worth of rent for the last financial year because 4 of those months we were travelling and had sub-letted our room.
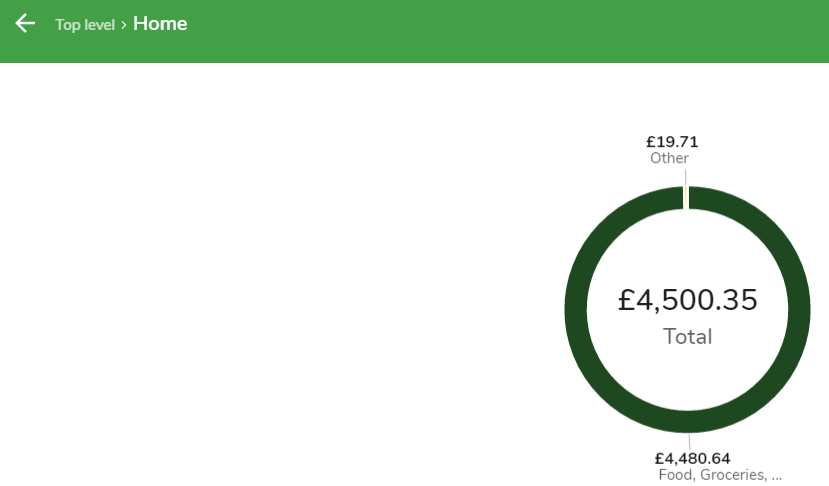
Food and Groceries is one area that we have been really lazy with. Unfortunately, overpaying for the sake of convenience is a common occurrence when we shop at the moment. We’re not set up to succeed with this category in London. I’m missing a few key kitchen utensils that I can’t justify buying because we’re leaving this year plus the freezer is not that big which makes it hard when you have to share it with 4 other people and It’s just generally harder to meal prep without spare time. We still do meal prep a bit but I’ve often found myself asking Mrs. FB if she wants to go out for dinner because it’s an amazing night in the city and I’m exhausted from work and don’t want to deal with the messy kitchen back home.
These are all excuses but the difference really can be night and day when you create an environment to be successful with anything in life vs trying to push a rock uphill. If you study in a quiet library you’re probably going to have a better chance of retaining the information vs trying to study whilst watching Netflix. If it takes you 30 minutes to get to your gym, you’re probably less likely to keep a consistent training schedule because it will be easy to justify not going etc. etc.
This is one area I can’t wait to improve on when we’re back home. A veggie garden will be built asap when we finally have a backyard again 🍅🥕🥒😁
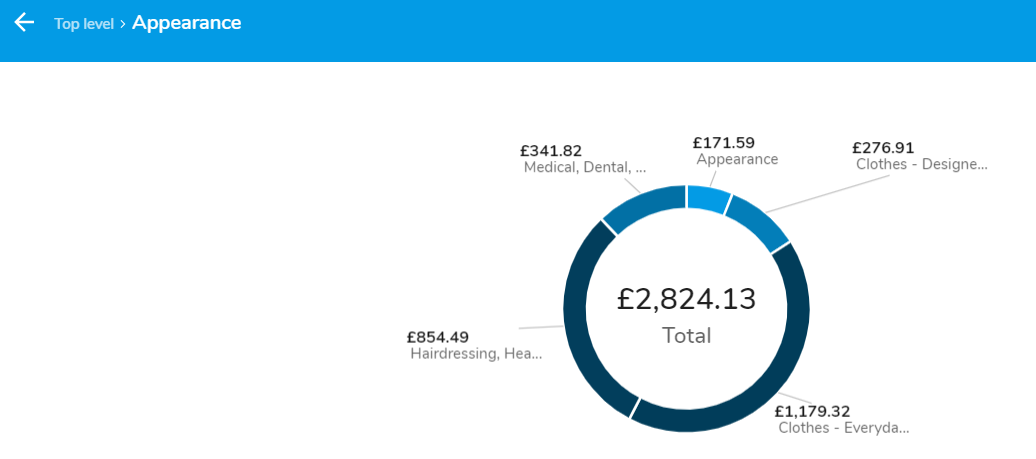
I’m gonna go out on a limb here and say that 80% of this category can be attributed to Mrs. FB 😜
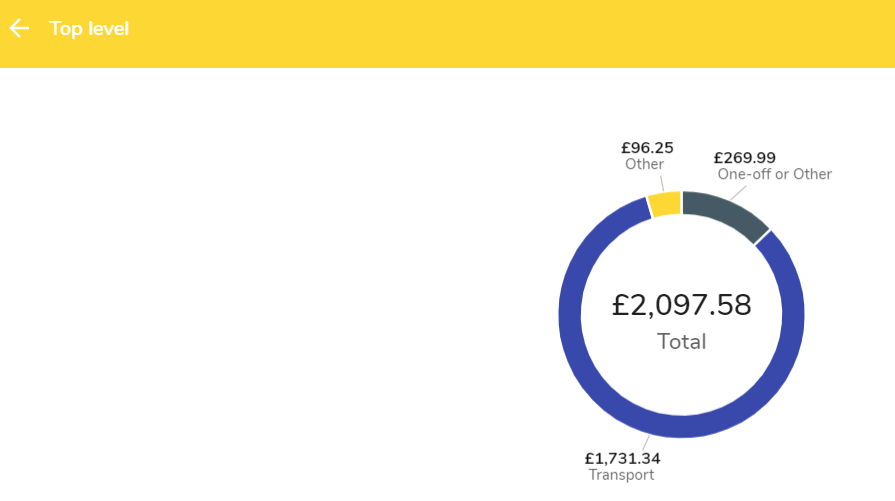
Buying a bike and COVID hitting has reduced our transportation costs enormously.
Breakdown Of Income
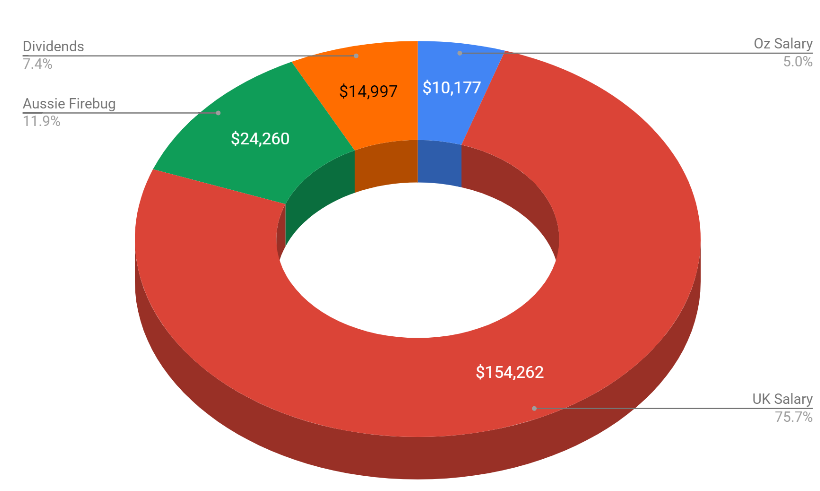
All numbers are in AUD
* There were a few big expenses for the properties during the last FY and it resulted in them actually costing us $2,776 🤦♂️ which is why you don’t see rental income in the above pie
It’s absolutely insane that we managed to earn $200K mostly after-tax considering how much travelling we have done during the last financial year.
When we decided to YOLO at the start of 2019 to live out a life long dream travelling Europe, I was convinced that my dream of FIRE would have to be put on hold and this once in a lifetime trip would delay our financial independence for a few years. What I honestly didn’t expect to have happened was the dramatic increase in income. I work in data (currently a BI Dev) and always knew that Melbourne and Sydney offered a higher paycheck for the work I do but those cities have a much higher cost of living than the country so I never really bothered pursuing it figuring the net gain might be a little bit more but not that much.
Well, let me tell you right now that London contract rates for tech workers are insane!
Before I get into exactly what I was paid I want to remind everyone (especially any newcomers to this blog) that my average wage, previous to moving to London, hovered around $90K for 8 years. My first job out of uni was around $72K in 2011 and it peaked at $110K before I left Australia which I understand is still high (especially for the country). I really want to emphasise that FIRE is possible without a high salary. It might take you longer, but almost every Australian can realistically reach financial independence with the right lifestyle.
With that being said, my first two contracts were at £500 a day and the one I’m on now is a fixed-term contract for 10 months with a base of £80K plus a £20K bonus.
That’s a lot of money, to begin with. But what makes the contracts outrageously lucrative is the way that limited companies are taxed in the UK (you need to be a resident of the UK for tax purposes to take advantage of it). I’m not a tax expert and I don’t know why they even do it the way they do, but for whatever reason, you essentially get taxed bugger all if you operate outside of a ruling called IR35.
Let’s assume that I worked for 12 months with a £ 500-day rate (I was actually asked to extend one of my contracts but had to turn it down because we were travelling during the European summer and the amount of money I was passing up did kill me inside a little bit 😂) which works out to be £130,000 a year. Here is roughly how it breaks down according to the laws currently using a UK Contractors calculator.
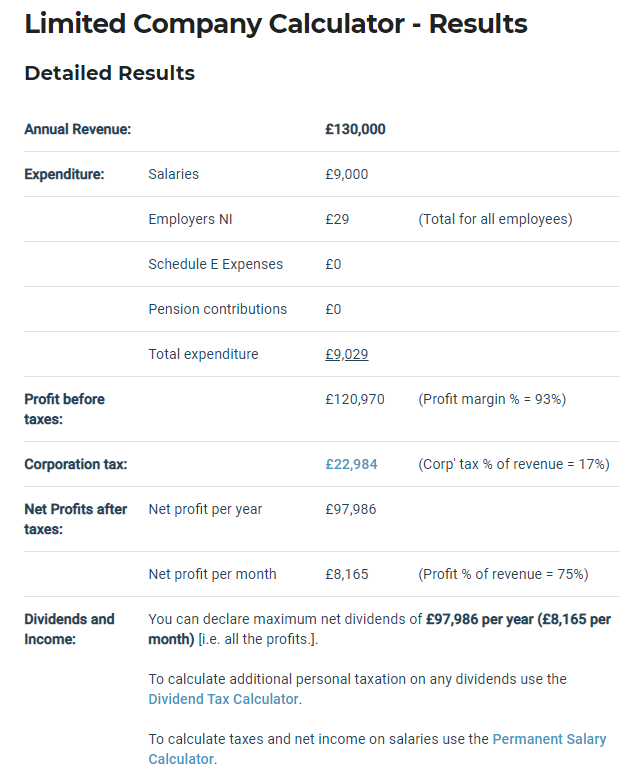
So you can take a £9K salary from the company which is like the minimum wage which means you won’t have to pay any tax on that part. The rest can be taken from the company as a dividend which is where the tax rates are insanely low.
So taking £97,986 as a dividend with the current tax rates looks like this.
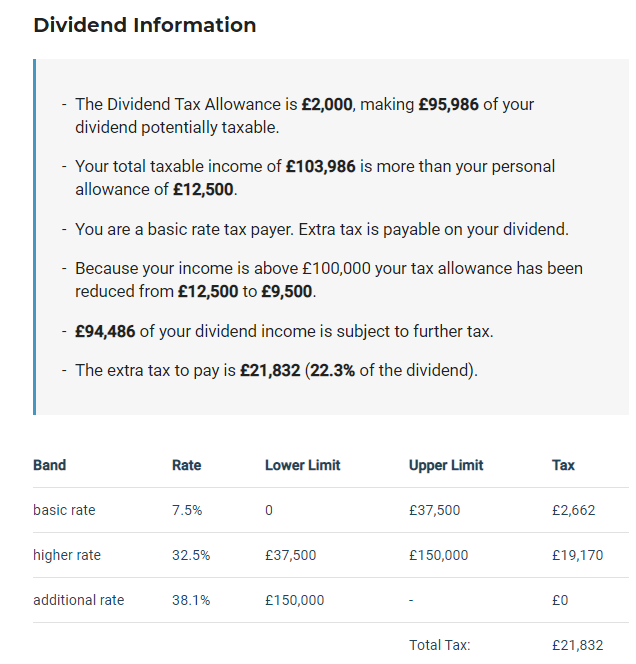
Those rates are crazy low! If we double the £ to make the conversion easy that essentially means that someone who received AUD $188,972 (£94,486 * 2) as a dividend only paid $43,664 in taxes. The equivalent for a salaried worker in Australia earning $188,972 is ~$62K in taxes and that’s including with the $18K tax-free allowance!!!
So if we wrap up everything here and assume I did accept my contract extension that lasted 12 months. I would have ended up with:
£130,000 (annual revenue) – £22,984 (corporation tax) – £21,832 (taxed owed for dividends) = £85,181 after-tax income
If we double that number we get AUD $170,362.
I would have to be earning ~$280K AUD as a salaried worker to get the equivalent after-tax income 🤯🤯🤯
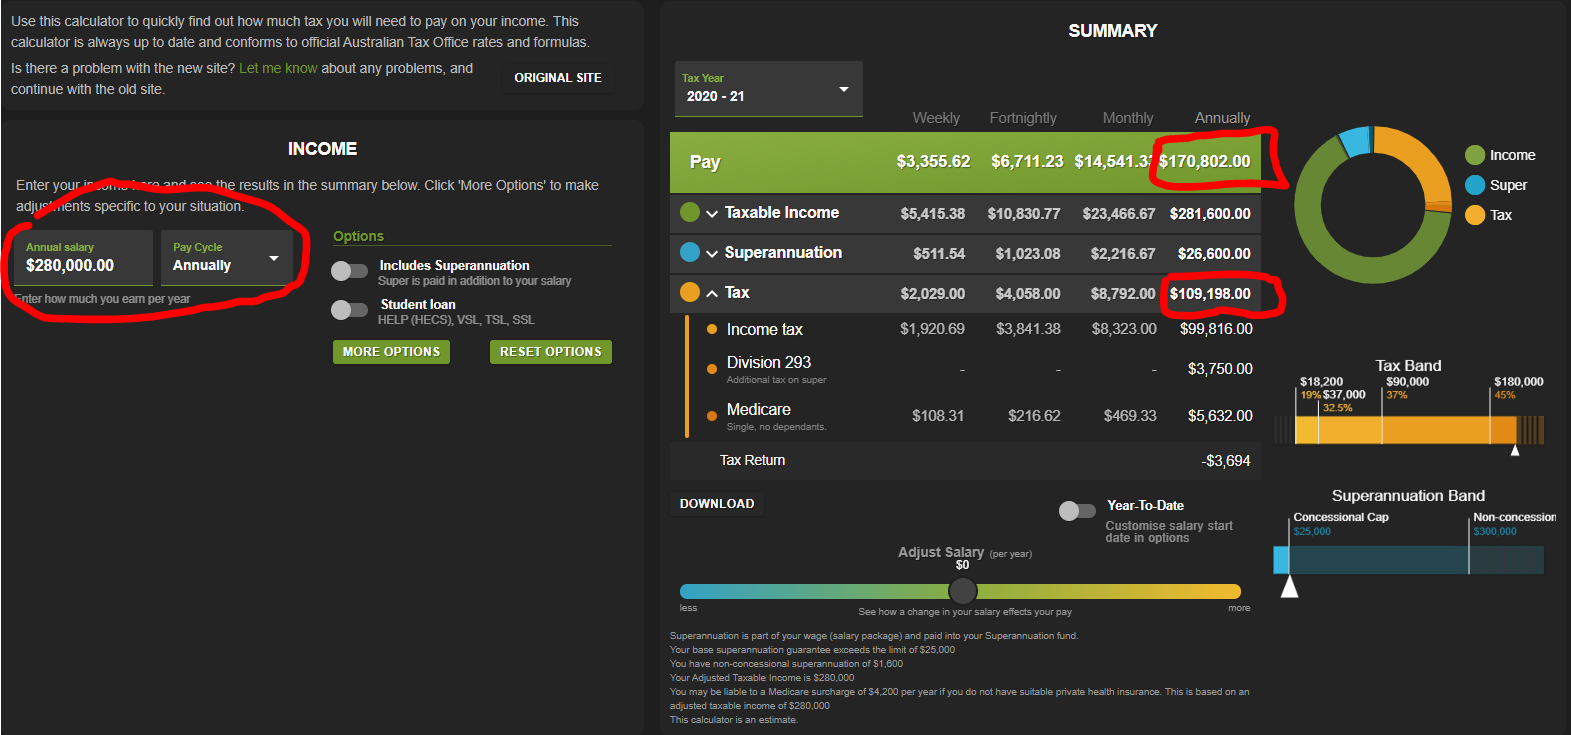
https://www.paycalculator.com.au/
I mean… that’s more than some CEOs right. I would never, ever, ever have thought that this earning potential was out there.
I can only really speak for tech jobs (mainly in data) because I’m not too sure what the difference is like for other fields. Mrs. FB, for example, makes almost the same here and when you factor in the difference in living costs it was definitely a net negative for her to move across.
If you’re in one of the following (there’s a lot more but these spring to mind):
- Data Analyst
- Data Scientist
- BI Developer (Power BI, Tableau, Qlik)
- Data Analytics
- Data Engineer
- Data Warehouse Architect
- Data Pipeline Developer (SSIS, Data Factory, Alteryx)
- Software developer
- ML/AI specialist
- Dev Ops
- Cloud Architect (AWS, Aszure, GCP)
There’s a lot of money to be made out there (assuming you’re willing to move).
Unfortunately, the crazy low tax rates for contractors are coming to an abrupt end next year. It was actually meant to end this year but COVID hit and they postponed it another year. I don’t know what things will look like after they make the changes but I’m glad I was around before they did.
I have to admit that my eyes have been opened after working these contracts in London. Sometimes I feel like we, in the FIRE community focus too much on reducing expenses and investing but nowhere near enough on trying to earn more money. I recently wrote a bit more about this subject in Pearler’s ebook project actually. And low tax rates are not something that’s unique to the UK. I’m pretty sure Singapore has a really low-income tax rate and Dubai has no income tax at all!
Reducing expenses is still 👑 but I’m convinced that so many people reach a point where they would be served much better investing in themselves and trying to find a higher-paying job. It can really help the process!
This blog had another amazing year generating an after-tax income of ~$24K. The taxes were brutal for me this year because I’m a UK resident for tax purposes (to take advantage of the crazy tax rates) which means I pay a high rate straight out the gate for all income made from AFB.
The craziest thing about this site still being able to generate some serious cashola is how little time I have spent on it during the last financial year. I’ve spoken about this before but I put a crazy amount of hours into this passion project for the first three years. And it didn’t flip a cent because I never cared if it made money or not. There’s no way you’re going to work on a project for 3 years without making any money if you don’t love it! But all that hard work is still paying dividends today because a lot of my traffic is still generated from some high ranking articles/podcast there were made all those years ago.
We’ve just been so busy during the last year that I haven’t been able to make as much content as I would have liked. Shit, I haven’t released a podcast in three months but I’m still ranked at 38 (humble brag 😜) for Aussie Business Podcasts according to Chartable. I guess my point is that even though I’ve really been slipping with AFB stuff, the site/podcast continues to churn away even when I’m sleeping. The internet is an insane bit of technology!
Dividends were broken down like so:
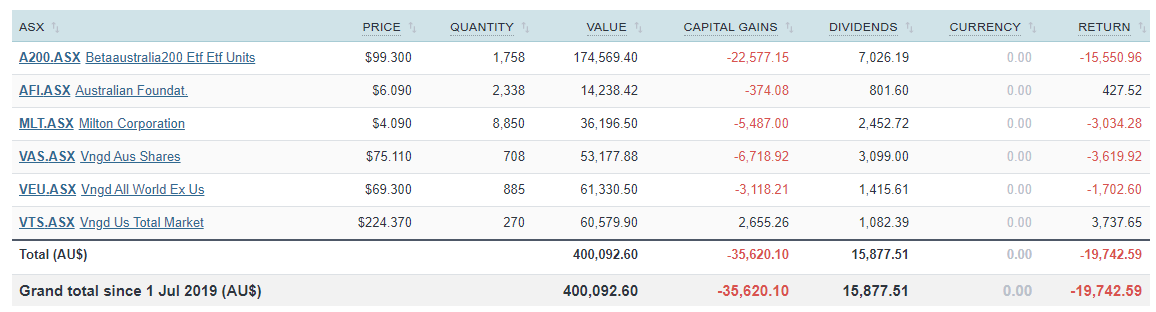
Nearly $16K even with the effects of COVID! Pretty pumped with that tbh. It’s just shy of double what we received last year ($8,057) so I’m really happy with how things are progressing. It’s going to be interesting to see the results for these next coming 12 months but after a few years (hopefully), if the payouts are similar to what they have previously been, we should see a strong uptick in dividend income which is really exciting!
What About You?
That’s it for another year!
Tracking your expenses is a must if you’re serious about financial independence because unless you know how much you spend, you’ll never know how much passive income you’ll need to FIRE. I’ve been blown away with the job market in London for my field and it’s opened my eyes to what’s possible earnings wise. This has been an unexpected benefit of moving to another country but a welcomed one at that.
So how did you go the last time you checked your expenses? Is there an area you’d like to rope in? Or maybe investing a bit of time and energy into your earning capacity would pay even higher dividends.
Let me know what you think in the comment section below 🙂
Spark that 🔥
-AFB
by Aussie Firebug | Oct 22, 2019 | Investing, Mindset, Saving
This years review was a lot more complicated to calculate because we earned and spent money in two different countries which meant keeping track in two different systems. The tax was a bit tricky too and it has taken a lot longer than I would have hoped but better late than never!
You can check out last years review here where we achieved a savings rate of 66%.
So how did we do this year?
Let’s get into the numbers.
Savings Rate For 18/19 Financial Year
Our savings rate for last financial year was… 56% (▼-10% from last year)
We earned $185,441 (▲+$43,944…mostly after-tax*)
And spent $80,817 (▲+$32,818)
Compared to last year we increased our income by $44K, which is great but unfortunately, that was accompanied by a record-breaking amount of expenses which was mostly due to our travels. We spent more than $32K compared to the previous year which decreased our savings rate by a whopping 10%. This further illustrates that it’s the expenses that are a lot more important vs how much you earn when it comes to your savings rate!
I’m pretty stoked about 56% tbh. It’s a fair dip down from 66% but considering our travels this year, we can’t complain at all.
I’ve included a breakdown of our income for this years update too so you can get an idea of where our $$$ come from. But the really important part is still the expenses.
*I’m still in the process of completing the tax obligations for the trust and AFB. I’ll update this article when it’s done
Breakdown Of Spending
Below is our Australian expenses for the last FY.
And in pie form
Holy Mackerel our ‘Holiday and Travel’ category exploded into our number 1 expense which isn’t all too surprising really. Majority of that $23K was the costs of flights, accommodation, food/drink and cash out for activities. It also covers some of our London setup costs when we were still using our Australian Money to pay for things before we set up our UK account. It’s a lot of money and it’s crazy how it all adds up but this trip (that we’re still on) was never about saving money. It’s not something we plan to have in our yearly budget once we FIRE though.
Not surprisingly, rent and groceries come in next which was our number 1 and 2 expense for last year.
‘Health & Beauty’ came in 4th because Mrs. FB had a toothache about 4 months before our trip which resulted in an operation to remove her wisdom teeth. We went private because we needed it done ASAP but it cost around $3,500 💸. If we had more time to plan properly, I would have liked to research how much it would have cost in Maylasia or somewhere similar. I’ve heard stories about how dental care there is just as good as in Australia but 1/5 the price.
‘Transport’ was the new category instead of our ‘Car’ one for last year. It went down a little because we left Australia in January and only had ~7 months of Car expenses instead of 12.
‘Food & Drink replaced ‘Entertainment’ and went slightly up.
Our ‘Gym membership’ went way up because I started to train Brazilian jiu-jitsu twice a week but I absolutely love it! I’m still a white belt and haven’t found a gym to train in London unfortunately.
Those were the main ones with the rest of the expenses being pretty similar to last year. Nothing else really jumps out at me.
And here is our break down for the UK
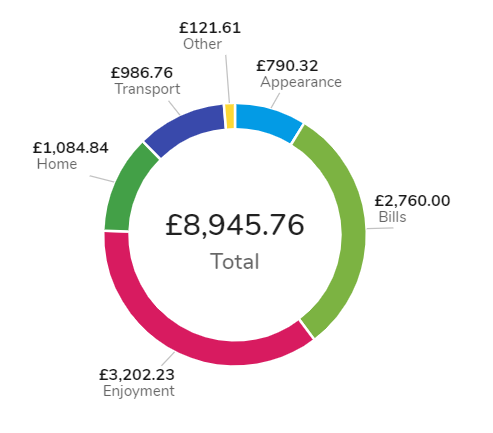
We use an awesome money management tool here in the UK called Money Dashboard which works very similar to Pocketbook but it’s actually a lot better. For one, you can split transactions! This has been a feature request I’ve wanted pocketbook to do for like 3 years but they just won’t bloody do it!
Anyway, our ‘Enjoyment’ category has been our biggest expense while being in London and it drills down to look like this.
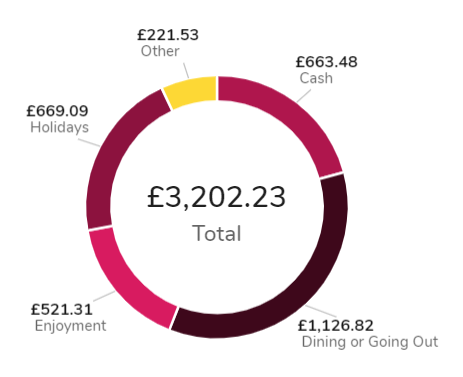
To say we have been ‘treatin’ in London when it comes to our ‘enjoyment’ category would be an understatement. Part of experiencing our new city has been taking advantage of what it offers in terms of sporting events, restaurants, concerts, activities and nightlife. The funny thing is, we don’t actually spend that much compared to our friends over here. We still take a packed lunch, get the bus/train, look for things second hand on GumTree etc. It’s just that if I compare how much we spend on doing ‘stuff’ in London vs back home in country Victoria, it’s been a blowout!
‘Bills’ has been mostly made up of our £900/m rent costs and ‘Home’ covers all our groceries home set-up costs.
Breakdown Of Income
A new addition to the yearly update. I thought it might be helpful for people to see where we earn our money and how we have built multiple streams of income that contribute to growing our snowball.
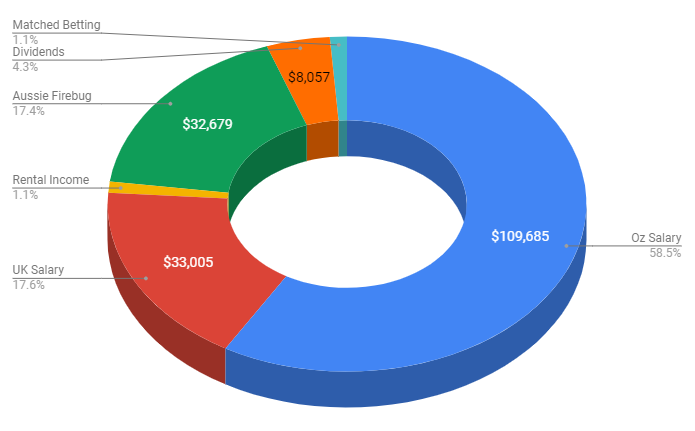
No surprise that exchanging our time for money (a job) generates the bulk of our income. A combination of our Australian and UK salaries equate to over 70% of our income. But the remaining 30% is a little bit more interesting and is part of the pie that we are aiming to grow over time.
This blog generated an astonishing ~$33K during the last F/Y (excluding taxes). That was through a combination of sponsorships on the Podcast and affiliates. I only started to seriously monetise this site last year with companies I was already using. I actually pioneered a few affiliate programs that you now see being used by a lot of other bloggers/authority figures. It’s amazing what a simple conversation can do.
I approached some of my affiliates with something along the lines of
‘Hey, I use your service and love it. I often recommend your product on my website if people ask. Would you be interested in buying some adverting space on my podcast or maybe an affiliate where my audience gets something that’s not available to them now? What do you think?‘
Sometimes I don’t hear back from them, but other times it works out better for everyone. I end up getting paid for my work, my audience gets a better way to sign up with a company I use and recommend, and that great company gets a new customer!
A lot of people have mixed feelings about monetising a blog. I’m a huge sceptic myself whenever anyone receives a financial incentive for recommending a product and there’s really nothing I can say or write that will convince some people otherwise. I’m pretty transparent on this website and I would like to think that I’ve built up a certain level of trust amongst you all, but I understand that there’s always going to be people who don’t dig it.
Having a side hustle can be a huge accelerator towards FIRE. But let me tell you straight up, if you’re thinking of starting a blog with an intent to monetise it later, you’re probably not going to get far. And even if you do, I’d doubt you’d make anything worth your while if money was the sole intent. If I was to divide the money made from this blog by all the hours I’ve put in, I’d be much better off working at Hungry Jack’s on minimum wage. This site is about money but was never intended to make any, I simply love creating FIRE content for Aussies and will continue to do so with or without the sponsors/affiliates.
You can see every company I’m affiliated with on the resources page.
Dividends were broken down like so
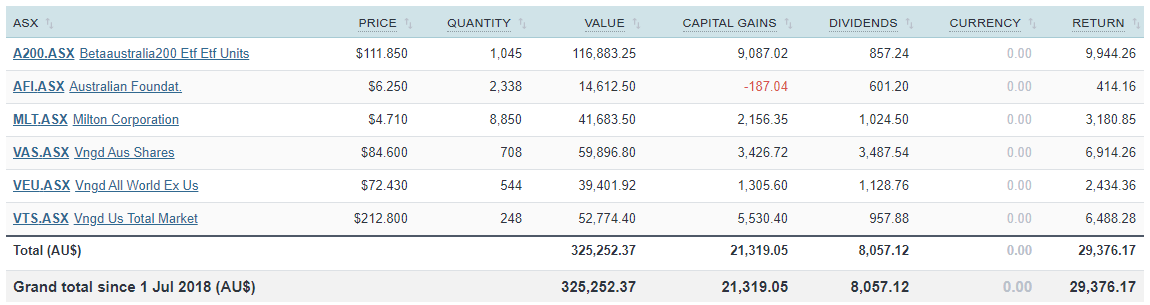
I’m stoked with $8K but am really looking forward to seeing the results of this report next year. A200 only returned $857 mostly because it was a new fund. Considering we currently have over $150K in that ETF as I write this now, the dividends should be closer to $5K-$6K assuming there’s not a crash or bear market. This is the slice of the pie that we want to grow as much as possible and will become the foundation for our financial freedom. It’s so exciting seeing the income grow each year especially now it’s starting to add up to a considerable amount.
I mean shit, even at $8K a year, that’s a kick-ass yearly holiday for the rest of our lives! Not to mention that even if we never added another dollar to the snowball, it would continue to grow faster than inflation and consequently raise the income without us having to do anything!
We ended up making just over $2K from matched betting which came mainly from the signup bonuses of the bookies. While it is possible to continue making money through matched betting, it takes time which I didn’t think was worth it for me personally after we had exhausted the sign-up bonuses. A Family On FIRE documented her experience using matched betting as a side hustle which is a fantastic case study and well worth reading if you’re considering trying it.
And last but not least we have the good old rental properties generating us a measly $2K. I’ve said it before but I’ll say it again, Australian residential property absolutely sucks at cashflow. The amount of time and effort I put into our two remaining properties with all the banks, conveyancing, tenant issues, chasing rent etc. makes it laughable that they only returned ~$2K cash last year. Now we all know that the real reason most people invest in Aussie property is for that sweet, sweet capital gainz gravy but eh… I won’t know how much that turns out to be until I sell and it doesn’t help me until then.
What About You?
That’s it for another year!
My number one tip has always been to track your expenses. You won’t ever know how much passive income you’ll need to FIRE unless you do and it creates good financial habits. I hope this post was helpful to you as it’s always interesting to see what people spend their hard-earned dollars on.
What about you? Do you have a category you really need to rope in? Or maybe it’s time to look into a side hustle to boost your income?
Let me know in the comment section below.
by Aussie Firebug | Jul 29, 2018 | Investing, Mindset, Saving
Since we do all of our accounting at the end of the financial year it only makes sense to see how we did in terms of savings in July.
You can check out last years review here, but to sum up 16/17, we achieved a savings rate of 63%.
So how did we do this year?
Let’s get into the numbers.
Savings Rate For 17/18 Financial Year
Our savings rate for last financial year was… 66%
We earned $141,497 (after tax)
And spent $47,999
Sooooo happy with 66%! At the end of 2017, I posted our financial goals for 2018 and one of those goals was to achieve a savings rate of 65% or above. We ended up coming in last year at 64% 😭 haha, so I’m very pleased for us to reach 66% at the end of this financial year. Hopefully, we can carry it through until the end of the calendar year 🙏.
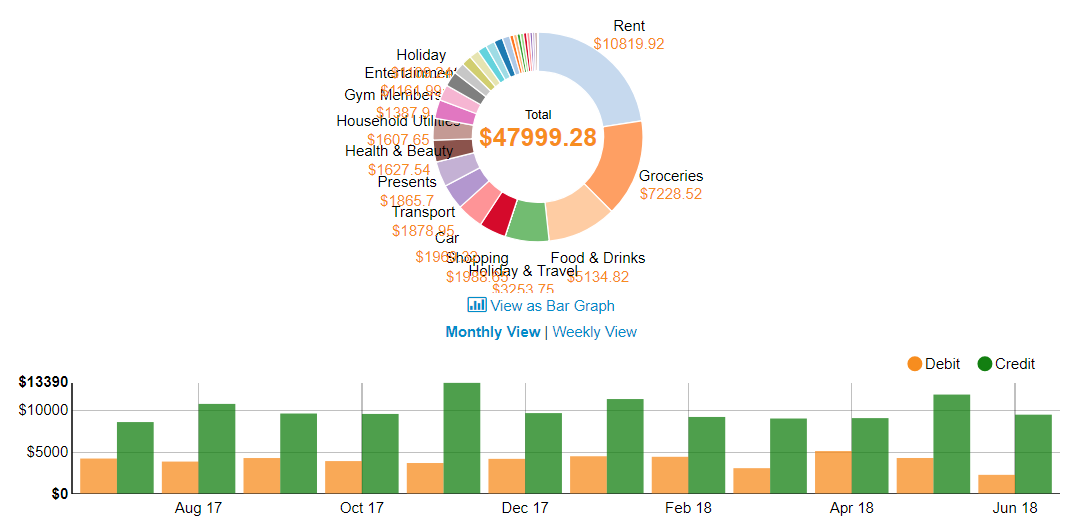
Breakdown Of Spending
So what did our precious $$$’s go?
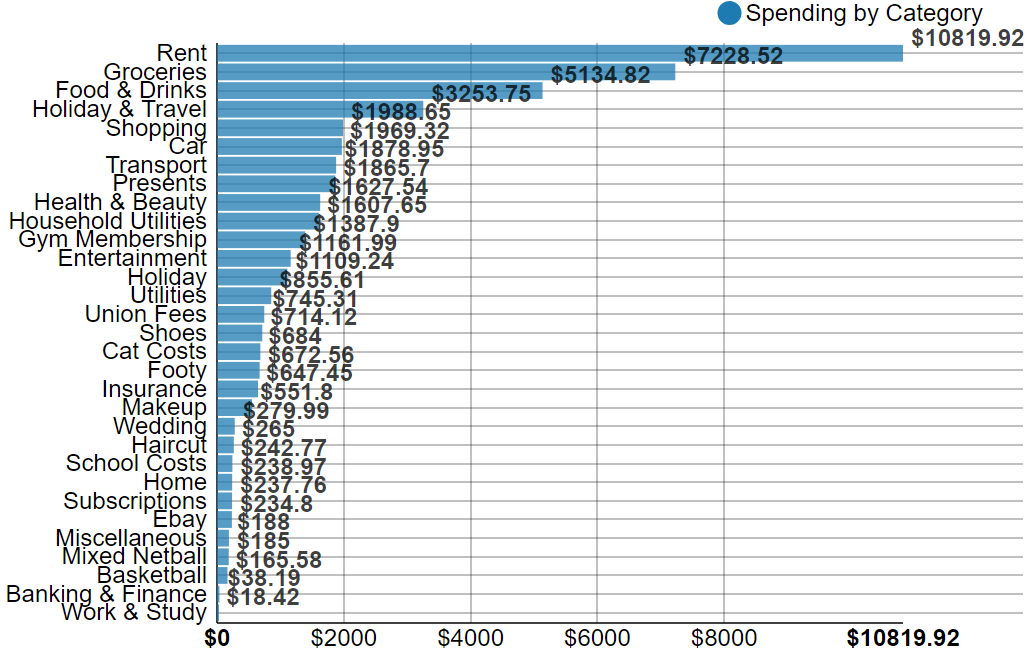
And in pie form
There are a few little issues with the tracking categories for this year because Pocketbook had a major revision of their categories and it resulted in a few double ups and what Pocketbook thought something should have been categorized as and my interpretation. For example ‘Car’ was a major category for me using this software, but Pocketbook replaced a lot of my ‘Car’ transactions as the new category ‘Transport’. There’s also ‘Holiday and Travel’ and ‘Holidays’. The overall numbers are correct just some of the categories might not make much sense.
A few interesting things to note about this year’s breakdown compared to last years.
Rent and groceries still dominate the top spots so no changes there.
Interestingly ‘Food and Drinks’ came in at number 3. This category includes alcohol and going out for breakfast and dinners. It’s really no surprise that it’s number 3 for the last 12 months. Since I changed jobs at the start of 2017, we made the move back to our hometown which has resulted in us being a lot more social. We go out for drinks on Friday nights (in Summer) and get to hang out with friends a lot more. This has resulted in a lot more money being spent on social things but I have to admit, it’s been absolutely fantastic and well worth the extra spending.
A positive from the move was that we are now driving on average, less than 400km a week compared to our old commute to work. This has resulted in us being home a lot earlier, generally feeling a lot better because we’re not stuck in our cars so much and $1,523 difference in fuel mainly from our shorter work commute.
Amazingly we spent nearly the exact amount on groceries which is very interesting.
The lack of weddings certainly helped our savings rate. But interestingly enough, we have booked a lot more holidays than the previous financial year. I have a feeling that’s because we went to so many weddings in 16/17, it scratched that holiday ich that usually starts pestering in the colder months.
We spent nearly $2k less on presents which makes sense due to the lack of weddings.
And all the other stuff is pretty much on par.
What About You?
It’s so important to track your spendings. It’s always my number tip for people to reach FIRE quicker. I’m stoked with a savings rate of 66%! But it can always be better.
How do you stack up? Maybe 66% is easy street for you or near impossible for others. Remeber, it’s not so much about killing yourself to achieve a higher savings rate, rather acknowledging where your dollars go each month and being at peace with that or changing it up if you’re not happy with the current status quo. But you’ll never know unless your start tracking 📈
So what’s your savings rate?
by Aussie Firebug | Jul 25, 2017 | Saving
It’s that time of the year again.
Time to review where every single one of the precious dollars we earned last financial year went.
This is usually an eye opener, but we review our spendings monthly so it shouldn’t be too much of a shock.
It will be interesting though because this is the first full year Mrs. Firebug and I have spent together with our finances joined.
I posted my savings rate last FY in this POST. I’m under no illusions that a savings rate of 74% will not be repeated again this year. I have hope that we will be around the 60s though. We did spend a lot of money when we moved with new furniture and what not.
Enough rambling, let’s get into it!
Savings Rate For 16/17 Financial Year

Our savings rate for last financial year was… 63%
We earned $137,419 (after tax)
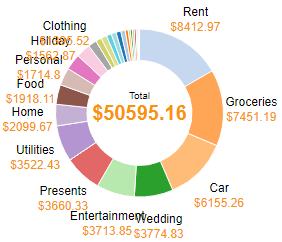
And spent $50,595
Pretty pleased with 63% tbh.
Anything above 60% was winning for us.
Being in a relationship is all about sacrifices. The last year by my standards was extremely luxurious with a heap of unscary spending. But Mrs. FB felt we were very frugal and tight. At the end of the day, it’s a sensible a sustainable budget that’s going to work and both parties need to be happy with it.
I felt we struck that balance this year gone. And as all the fellas out there know…
“Happy wife, happy life”
Even though I’m not married… These are words to live by ??
Breakdown Of Spending
Down to the nitty gritty.
How in the hell did we spend over $50K!?
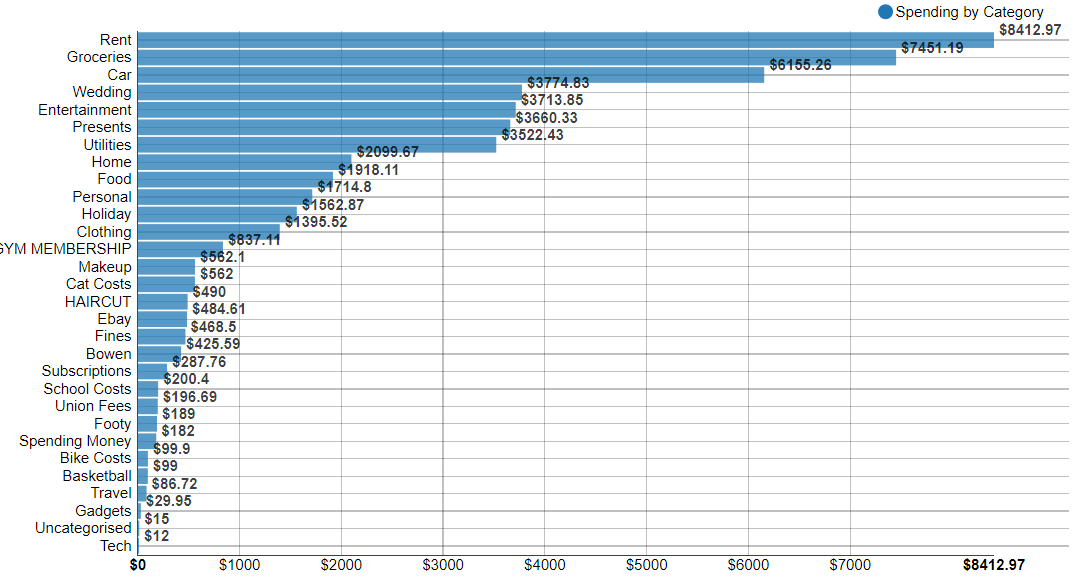
and in pie form
Let’s start with our biggest expense…RENT!
$161 bucks a week is great. But that included 2 months house sitting my parents home before we moved into our new place. So it’s really about $195 bucks a week which sounds about right.
I’m sure some Metropolitan readers out there are shocked at how low that rent is, but that’s just one example of the cost of living differences between the city and the county.
Groceries is next up. Man, we eat a lot! But let’s break it down to how much we spend a day to fuel our bodies.
$7,451 on groceries + $1,918 on food + $2,176 on entertainment>food
Those three different categories account for everything we consume (except booze)
= $11,545 a year on food
=$222 a week
=$31 a day
=$16 a day per person
It’s actually more like $21 per day for me and $10 per day for Mrs.Firebug because I eat so much more than her.
I have to be honest. I’m actually shocked that we only spend $16 a day on food each. Considering that this figure includes every time we go out for dinner for like $70-80 bucks, breakfast Sundays, birthday dinners …everything. I eat 6-7 meals a day too. We could definitely improve this category by not going out so much but we live a great lifestyle and there’s always fat to be trimmed if we need to I guess.
It helps that we both make our lunches every day and hardly ever go out during the week.
The car expense is pretty standard. With the change of job this year, the fuel costs should go down though.
And then comes 3rd place…WEDDINGS!
That’s right, we spent $3,774 attending, participating, flying to and from weddings in 2016/17. CRAZY!
The only other two things that jump out at me are how much we spent on presents and utilities.
I know it’s hard because every household is different but is $150 a month a decent usage amount for gas/electricity? I’d be interested to know how much everyone else spends on utilities.
How Do You Compare?
We managed a 63% savings rate last FY. This included rent, food, car costs, holidays, a bunch of weddings…absolutely everything!
And it didn’t feel like we sacrificed at all! In fact, I still think we could cut out heaps of unnecessary spendings if we really needed to. But as mentioned earlier. Reaching FIRE with a partner is about sacrifice and compromise. And I felt like we struck a nice balance last FY.
But I will use this year’s numbers to set the target for next year.
70% here we come!
by Aussie Firebug | Jul 31, 2016 | Mindset, Saving
Lets talk savings rate for a second. It is in my opinion THE most important factor to FI (financial independence) and determines a lot of things like:
- Whether you actually reach FI
- How long it will take you to reach FI
- Gives you a clear indication as to what your FI number is
It’s really the foundation for the concept of financial independence retire early (FIRE) which is what this entire blog is about.
There are only three things you need to do in order to become extremely wealthy:
- Spend less than you earn
- Invest the rest
- Wait
The very first step in becoming rich enough to retire early is to save your money. The second step is what gets most of the limelight and chatter.
Investing.
But don’t get it twisted. You won’t EVER invest your way to FI if you don’t spend less than what you earn, because that’s… you know…impossible.
And finally the third step is the time you have to let compounding interest dominate for you.
There could be an argument made for the amount of time you have as the most important factor but it’s kinda out of your control as in you 1. don’t know how much time you have (could die tomorrow) and 2. Can’t change it even if you knew you had X amount of years left. You have a lot more control over whether you spend less than you earn.
Savings Rate For Last Financial Year
Let me cut to the chase.
My savings rate for last financial year was…
74.39%
Last financial year I made $72,105.04 (after tax) and spent $18,468.42.
One of my top ten tips (LINK TO TIPS) I suggest to people trying to save money is always, always track your spending.
As the old saying goes ‘A goal without a plan is just a wish’.
You cannot set a plan of attack without knowing exactly how much you spend. You know roughly what your income is going to be, you then need to plan for the amount you want to spend each year to achieve your goal of whatever spending rate you choose.
Breakdown Of Spending
There are two ways you can track your spending:
- The hardcore way = manually inputting ever transaction into an Excel spreadsheet
- The easy way = Using an online service that feeds into you bank account (something like pocketbook)
I use the easy way but there is absolutely no problems using the hardcore method.
Let’s have a look at where my cash went last year
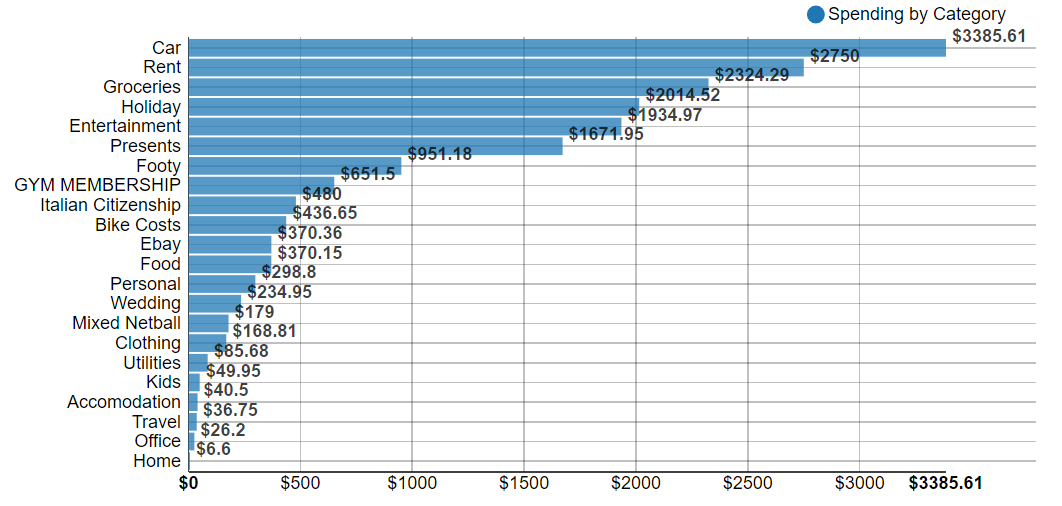
Below is the same data but represented in a pie chart.
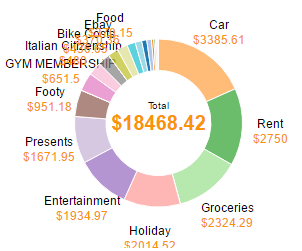
One of my favorite features of Pocketbook is its ability to create sub categories. My biggest expense is my car for example. I spent a total of $3,385.61 dollars on it last FY. But that’s a little vague isn’t it. Luckily I recorded sub categories for it and can dig deeper into the overall ‘car’ category to see it.
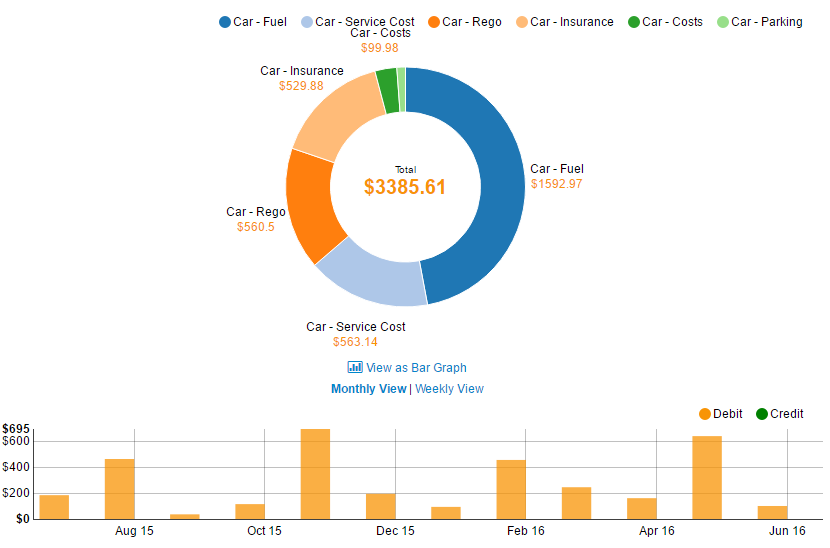
Pretty cool huh.
The software lets you see where the costs came from and even what months you spent the most amount on. The above are screenshots only, but this graph is actually interactive which is pretty cool because you can un-select multiple sub categories from above and the pie will change and you will see the spending per month change on the fly. This sort of stuff really excites my inner finance geek (what a sad existence I live lol)
Before You Ask
There are a lot of things missing or not quite right with my above spending, so before anyone points it out let me set the record straight!
- I only moved out of home at the start of this year hence why my rent is quiet low and overall expenses
- Everything above is only my income and expenses. I do however pay for me and my partner some times (like for dinners and what not) but she also pays for things too so it’s hard to keep track of that. We have not yet joined finances
- My rent ($110 a week) covered gas, electricity , internet, and water. This was a room share deal in the county (cheap as chips)
- I don’t pay a phone bill…sorta. I pay the minimum which is around $20 bucks I think, every six months so I can keep my number from Telstra, this small expense falls under utilities. This means a don’t have credit and can’t call people when I’m out and about. It usually blows people minds when I tell them I don’t pay for credit and am not on a plan. But with the availability of open wifi’s increasing, it is my opinion that we will see less and less people buy cellular data/credit unless they’re in a remote area. Nearly all calls and messaging will be done through the internet in the future
- I have not included the costs (or incomes) of my investments
- I have not included my accounting fees because they are a deductible expenses associated with my investments. In the end I plan to transition completely to index funds and will be doing the accounting myself. Anything investment wise I keep off because I would then need to include the income generated by those investments to be fair and that would get tricky
- Costs associated with this blog are not included
- Going out to eat as an activity fall under ‘Entertainment’, food is where we had to eat somewhere but not as an activity (like at a petrol station) and groceries are anything bought at the supermarket
- I group ‘Holidays’ as one big expense and than create sub categories for each holiday. Anything that is spent on the holiday falls under that sub category holiday. If we buy groceries during a holiday, it will be categorizes as the holiday and not as groceries. Gives me a better indication about how much the holiday costs me
- ‘Presents’ covers gift to myself and others (Christmas, Fathers day, Valentines day etc.)
- ‘Personal’ covers health related things like physio, dentist, ambulance insurance etc.
- And no I don’t have any kids. The one expense for ‘Kids’ is because I recently became an Uncle
How Do You Compare?
I like to compare the savings rate to the nutrition for a professional bodybuilder. Some people say that Bodybuilding is 80% nutrition and only 20% the other stuff (training and sleep). You can’t out exercise a bad diet. Period.
You can train the house down 6 hours a day 7 days a week, but if you’re not fueling your body with the right amounts nutrients it needs to function and repair itself then you’re not going to see results.
This is the same for those striving for FIRE. A healthy savings rate enables you to invest capital. The better the savings rate, the better the results are going to be.
It’s a rookie mistake among first time gym goers. They concentrate so hard on their routine and make sure they put a solid 2 hours in, only to swing by McDonald’s on the way home from the gym thinking they have improved their health.
You would have been better off simply eating a healthy meal and NOT going to the gym!
Optimism your savings rate first, and then concentrate on the investing part.
A dollar saved is a dollar earned. Where as a dollar made isn’t really a dollar, it’s more like 0.70c because of tax. Think about that for a moment.
I would love to know what your savings rate looks like. Have you optimized your expenses so much that my measly 74% savings rate pales in comparison? Maybe this was an eye opener and now you have something to aim for?
Thoughts, feelings and emotions in the comment section below.

by Aussie Firebug | Apr 30, 2016 | Real Estate, Saving
It’s a decision most homeowners know all too well. Fixed or variable Rate? Do I fix my interest rate? Or do I go variable? Will the rate go up and I’ll feel like a champ if I fixed? Or will it continue to drop and I’ll just not tell anyone how much more I’m paying every month?
To Fix, Or Not To Fix?

There are some pros and cons for both. The main arguments made for fixing often include:
– Stability with repayments
– Laughing at others when rates rise
While the downsides usually are:
– Can’t make extra repayments
– Have to pay fees to set it up
– No offset
– No redraw
– Big, expensive, want to make you burn down the bank break fees if you ever decide you need out
– Crying internally if rates drop
Variable is basically the opposite of above where you have a lot more freedom and flexibility with your loan. You do pay for this extra freedom however by exposing yourself to more risk.
What’s interesting is that at the moment of writing this article you can find plenty of fixed rates that are lower than variable. I had a quick look at some historic fixed or variable rate data and it seems that this is not so uncommon.
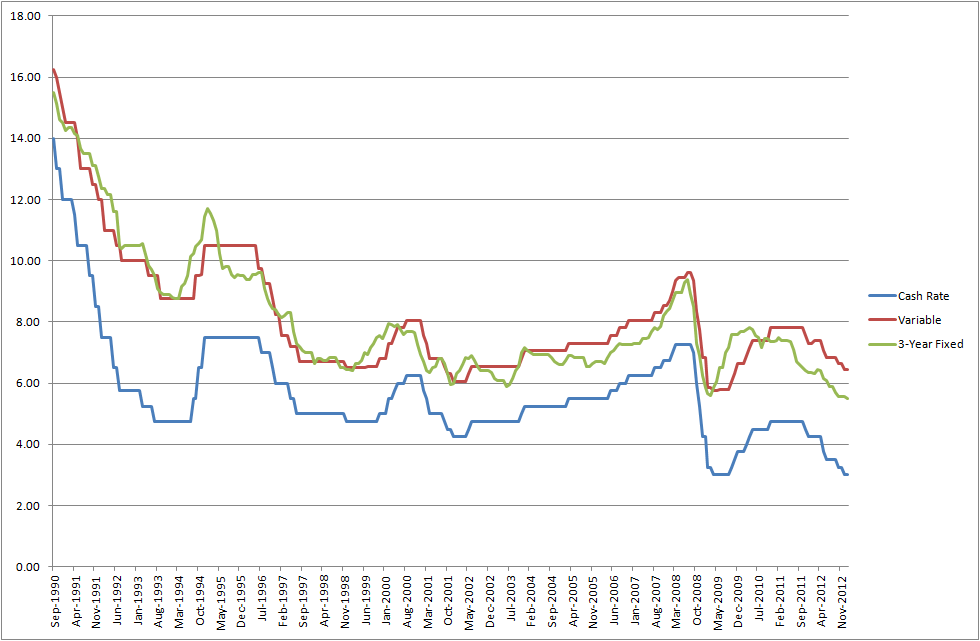
Source:RBA
I was under the impression that fixing your rate usually meant that you pay a higher rate but upon further research, this wasn’t the case.
So if a fixed rate is lower than your variable AND provides the security of a fixed rate, there’s no reason I shouldn’t fix right?
Yes and no.
Make no mistake about it. The banks are ALWAYS aiming to make the MOST profit at ALL times. If you think you will pay less by fixing your loan for 1, 3 or 5 years after you have factored in all the extra fees and potential rate movements then, by all means, go for it. But just remember that the banks have an army of analysts that are betting against you. Just look at the above graph and try to find a couple of years where fixing your loan will come out ahead.
And remember that you have to factor in the fees associated with setting up the fixed loan and keeping it.
Here are the CBA’s fees for fixed loans. Scroll all the way to the bottom to see the fees. They include:
- $600 upfront establishment fee
- $8 monthly loan service fee
- $750 Rate Lock fee. Applies to each Rate Lock. Only available on 1-5 year periods
That’s $1,446 in fees straight off the bat. How much of an interest rate hike would be needed for you to recover those losses and come out ahead vs variable? It depends on your loan and rate but there needs to be a BIG rate hike. And that’s just for one year. If you decided to fix for 5 years, the fees are spread out that’s true. But again, take a look above and try to pick any date where a 5 year fixed rate would still be lower than variable during its whole lifetime and by how much?
Are you starting to see how hard it is for this to actually pay off? There have been certain periods of time where fixing has been better no doubt about it. But how good and confident are you that you can get the timing right? The banks have an army of people working full time on this stuff and STILL get it wrong.
I truly believe that you’re gambling if you’re trying to fix your rate to save money. And the ones that win 90% of the time are the banks.
If you’re fixing for stability or peace of mind then that’s different. But don’t think for a minute that the odds are in your favor by fixing. If you do actually come out ahead it will almost certainly be because of luck and not your amazing analytic skills that you predicted that the banks didn’t.
Split Loans?

I’m not a fan of split loans because it’s sort of like taking the worst bits from each loan type and combining them into a shit sandwich.
Let me explain
Some of the main benefits from variable are:
– Loan flexibility
– Being able to refinance if needed
– Benefit from rate drops
– Offset and redraw
– Can pay off the loan at any rate you want
You get half of the offset, rate drop and redraw (assuming you split 50/50) which is Ok but none of the other benefits.
You still can’t refinance the entire loan, you still can’t pay off the entire loan.
Your flexibility is about as good as a pair of chalk hamstrings
You’re taking on all the risks associated with variable but not benefiting from all the advantages.
The main benefits of a fixed loan are:
– Stability with loan repayments
– Protection against rate rises
You lose both of those things with a split loan. Yes, you’re only going to have increased repayments from half the loan if rates do rise but then what was the purpose of fixing half the loan if your paying establishment fees for the fixed loan which will probably be more than the interest repayments from the rate rise???
And you’re stability is gone too because you still have the potential to pay more from the other half of the loan if you split.
But you still have to pay the setup fees plus you’re locked into the loan.
You’re getting nowhere near the benefit of either strategy but all the negatives from both. If you want stability and certainty then go with fixed. If you can handle rate rises, go with variable.
Wrapping Up
Maybe I’m wrong with my analysis of ‘fixed or variable rate’ and maybe I’m about to be blasted in the comment section about all the people who have ‘beat the banks’ by fixing their loan at a certain time. I’m a variable man, the flexibility, and freedom of a variable based loan is something that appeals to me. I think that fixed loans were invented by the banks to prey on the Ned Flanders of the world (the over cautious) and take more money from them by giving them peace of mind. That being said, if a rate rise means that you’re going to default on your loan, then you should definitely fix because you’re most likely overextending yourself financially. For the rest of us, riding up and down the variable roller coaster is financially better, for the majority of the time


